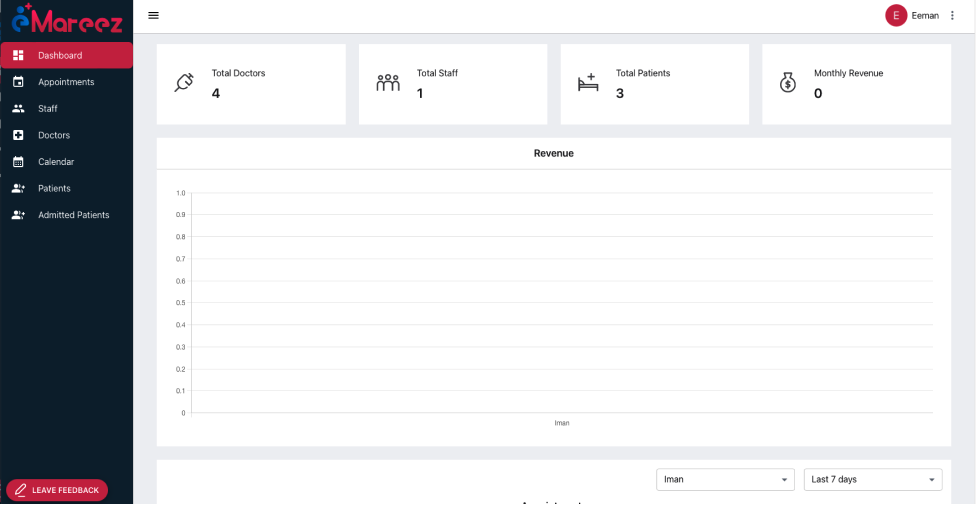
This runtime generated graph gives you a statitical report of the appointments. By this graph, the owner can analyze the pattern of appointments in association with the date of appointment. The graph also shows the the ratio of appointments associated with the specific doctor. The graph can be generated for the the recent week, month and year. You can see the total number of patients that got consulaton from your clinic, registration of new patients and the number of patients who came for regular follow up, ,respectively. Monthly revenue shows your income calculation of the month. Th dashboard also shows the total number of doctors, staff members and patients.